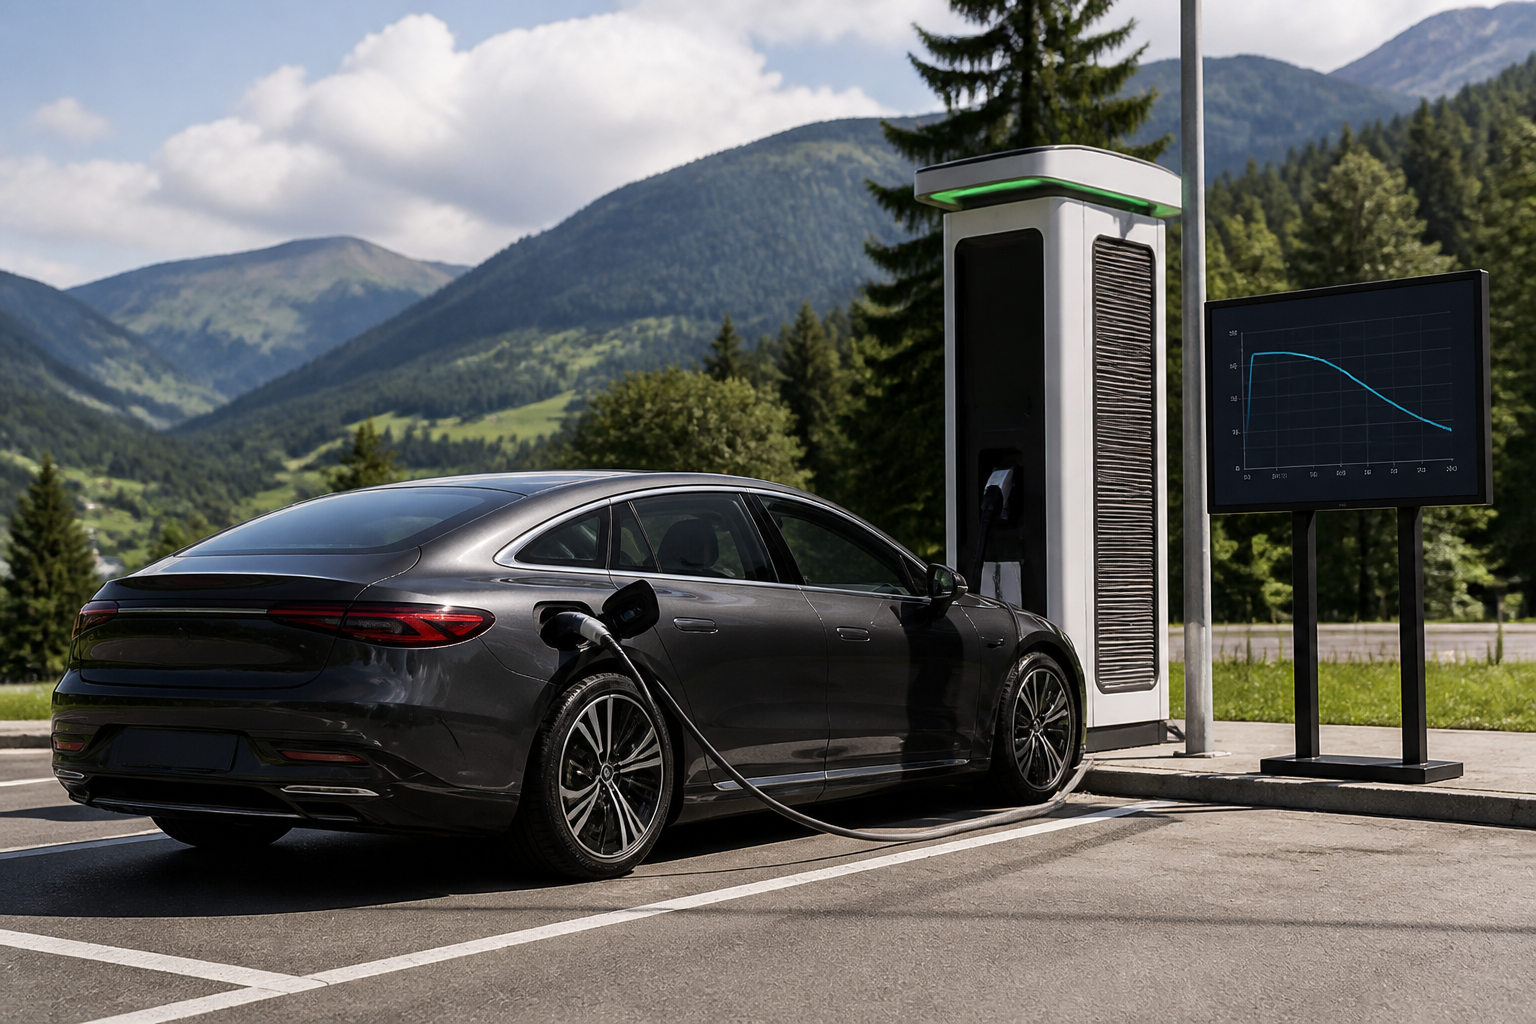
EQS charging realities: peak power can reach around 180–210 kW at the start of a fast charging stop, but sustained power drops as SoC rises, often down to ~100 kW or less by 80–90% SoC. For practical use, plan 60–80% fills at DC fast chargers, use home charging to fill remaining daily energy, and precondition the battery to maximize initial power. This reflects real-world test data showing peak versus sustained power differences.
Key takeaways
- Peak DC fast charging on the EQS is transient and does not represent the full stop.
- Expect lower sustained power after the initial fill, especially beyond 60–80% SoC.
- Plan long trips around 60–80% fast-charge targets to minimize total stop time.
- Use home charging for regular energy delivery and precondition the battery for better initial power.
- Real-world data from Edmunds and InsideEVs confirms the peak-versus-sustained power distinction.
The EQS stakes a claim as a flagship for Mercedes‑Benz’s electric strategy, delivering luxury, comfort, and technology at a level that helps redefine what an EV can feel like on the move. Yet, when you translate what the charger shows you into a practical charging plan, you quickly see that published peak DC fast charging rates are only part of the story. Real‑world charging is governed by a charging curve shaped by battery chemistry, state of charge, temperature, and the car’s thermal management decisions. The result is a useful distinction between peak power and sustained power across a charging session. This article translates lab‑style figures into everyday guidance for daily use and for long trips, so EQS owners and prospective buyers can plan charging stops with confidence.
EQS charging realities: peak power versus sustained power
Automakers routinely publish high peak DC fast charging rates to showcase capability. For the EQS, studies and OEM literature indicate that the car can reach a peak around the vicinity of two hundred kilowatts when the battery is in a suitable temperature window and at a low to moderate state of charge. But that peak is not a constant during the stop. Real‑world measurements—from independent testing—show the actual charging power evolving as the battery accepts energy and its internal heat management responds.
Edmunds’ EV charging tests illustrate this clearly. In their data for the 2022 EQS 450+ variant, peak charging power reached about 211 kW, while the session average sat lower, at around 185 kW. The practical takeaway is simple: you should expect a high, near‑peak rate early in the stop, but the charger display’s peak number will not stay constant for the entire session. The average rate across the stop better reflects the experience you’ll feel at the plug and the total energy you’ll accumulate during that visit.
Similarly, the EQS charging curve analysis published by InsideEVs shows the taper that accompanies rising state of charge. In their review of the EQS 450+, the power rose close to 200 kW early in the session but sustained that level only through roughly one‑third of the charging curve. By the time the battery reached around 80% state of charge, the output typically fell to roughly 100 kW, with a more pronounced drop as it approached 90–95%. In practical terms: the time penalty of pushing beyond 80% is substantial even if the charger can supply high power at the outset.
These observations are not unique to Mercedes. Many long‑range EVs show a similar pattern: a rapid initial fill, then a taper as thermal limits tighten and the battery reaches higher energy content. The headline number you see on a DC charger—often the peak kilowatts—will not be constant for the entire stop. For the EQS, the real number that affects your trip timing is the session‑average power and the total energy added by the end of the stop.
Interpreting charging data for real trips
To translate lab figures into practical planning, treat the peak kW as a ceiling rather than a guarantee at any moment during a stop. Expect a strong start—often near the published peak—within the first few minutes after connection. As the battery state of charge climbs past the 60–70% range, anticipate a gradual deceleration toward 100 kW or lower depending on ambient temperature and battery health.
The charging curve is highly sensitive to temperature. Cold or hot conditions can shift when the thermal system engages, which in turn alters how quickly the car can sustain peak power. If you arrive at a charger with a cold battery or after a long drive in heat, you might see a more pronounced early taper or a slower ramp to the peak power. Keeping the car near the target SOC window for charging—typically early, mid, and late‑stop phases—helps optimize overall time spent at the charger.
For planning long trips, focus on three practical metrics: the time spent charging at 80–90% SOC, the session‑average charging rate, and the total energy added per stop. The 10–80% or 10–90% times published by independent testers give a clearer sense of how long a stop will take than the single peak figure.
What to expect at public DC fast chargers
When you pull up to a public DC charger with an EQS, the initial minutes often feel brisk. If the station and connector are compatible, you may briefly see rates near the car’s peak power. The actual sustained rate depends on the battery temperature, state of charge, charger quality, and how many modules in the pack are currently accepting energy efficiently. In practice, you should anticipate a swift early fill, followed by a taper as the car approaches roughly the 60–80% range, with a more noticeable slowdown after 80% and into the 90s.
For planning purposes, many EQS drivers use public DC charging as a mid‑trip accelerator rather than a finish line. If a 15–20 minute stop is feasible in a corridor with reliable DC charging, the car can typically gain a meaningful amount of range early on. If you need to replenish to upper 90s, the stop can stretch into longer periods, unless you have access to higher‑power stations designed to sustain more energy at higher SOC in newer packs.
Home charging and daily use implications
At home, the charging pattern differs because you typically use AC charging, with a steady, moderate rate and a long overnight or daytime fill. Home charging is less about chasing peak kW and more about consistent energy transfer aligned with your daily driving. The EQS supports high‑quality onboard charging that works with common home setups. A Level 2 charger will provide a predictable rate, helping you plan a reliable daily SOC target by morning.
To optimize weekday use, estimate your daily energy needs based on your typical driving profile, then configure charging to stop at a practical SOC (often 80–90% for daily use in many regions) to balance battery longevity and convenience. This approach reduces the frequency of slower tapering near full charge while ensuring you wake up with enough range for the day’s tasks.
Practical guidance for EQS owners and buyers
- Know the difference between peak and sustained power: don’t rely on the peak figure as a constant during a charging stop.
- Use the session average power and total energy added as your real‑world guide to how long a stop will take and how much energy you gain.
- Anticipate a taper after about 60–80% SOC; plan long trips with this in mind by selecting charging stops that maximize energy per stop within a reasonable time window.
- Consider temperature and recent driving when selecting a charger: preconditioning the battery via preconditioning feature (if available) can help you start at a higher sustained rate.
- For daily driving, aim for 80–90% maximum charge at home to preserve battery health while keeping sufficient range for typical commutes and errands.
Model‑dependent caveats and limitations
All charging figures are subject to the vehicle’s software version, battery health, ambient conditions, and charging station capabilities. The EQS curve behavior described here matches reported lab tests and independent analyses, but the exact figures can shift with updates to Mercedes‑Benz software, changes to the battery cell chemistry in newer model years, or variations in charging infrastructure. When evaluating charging strategies, use the published peak rate as a heuristic—handy for understanding capability—but rely on real‑world observed session averages and the energy added to gauge trip timing and daily practicality.
In summary, the EQS demonstrates strong DC fast charging capability, but like many long‑range EVs, the most relevant number for planning is not the peak power alone. By focusing on the charging curve, session average, and total energy delivered, owners can craft charging plans that maximize convenience, minimize time at chargers, and maintain battery health across both everyday drives and long‑distance journeys.
Sources
- Edmunds EV Charging Test: How fast does each EV charge?
- Mercedes-Benz EQS 450+ Charging Analysis: As Fast As Plaid?
EQS charging: peak vs sustained power in real-world tests
| Metric | Observed values | Practical takeaway |
|---|---|---|
| Peak DC fast charge (EQS 450+/tests) | ~180–210 kW (start of stop) | Use this as a brief initial boost, not a long‑hold target |
| Sustained power during stop | ~100–150 kW as SoC rises | Plan to fill to 60–80% for fastest overall stop |
| 10–80% charging time (example curves) | ~30 minutes (varies by charger and temperature) | Expect meaningful time savings early, diminishing returns later |
Frequently asked questions
What should I expect at a public DC charger with EQS?
Public DC chargers can deliver high peak power at the start, but the rate tapers as the battery SoC climbs. Plan to reach around 60–80% rather than targeting 100% for the fastest fill.
Is home charging worth it for EQS ownership?
Yes. A Level 2 home charger provides steady energy delivery and allows you to top up everyday energy needs without waiting for a public charger, complementing DC fast charging on trips.
How long does charging take to reach 80%?
Times vary by charger, temperature, and vehicle state, but a typical EQS session can show rapid early charging followed by a slower ramp as SoC increases; expect a meaningful majority of time spent near the initial fast window, with slower steps beyond 60–80%.
Should I precondition the battery for a fast charge?
Preconditioning can improve initial charging power by warming the battery to an optimal temperature, helping you reach higher peak power sooner.
Related Mercedes-Benz guides
- Buying a Used Electric Mercedes-Benz: Battery, Warranty and Charging Checklist
- Charging ecosystems and home installation for Mercedes BEVs
- Charging Mercedes: home install, networks, and cost optimization
- 2026 Mercedes-Benz GLC EQ Review: 713 km Range, 330 kW Charging and Towing
- 2026 Mercedes-AMG GT 4-Door Coupé First Look: 1,169 hp and 600 kW Charging